Unreal Engine’s Stall Detector As The Core Issue
When integrating external GUI systems (such as VST plugin editors) into Unreal Engine, you may observe:
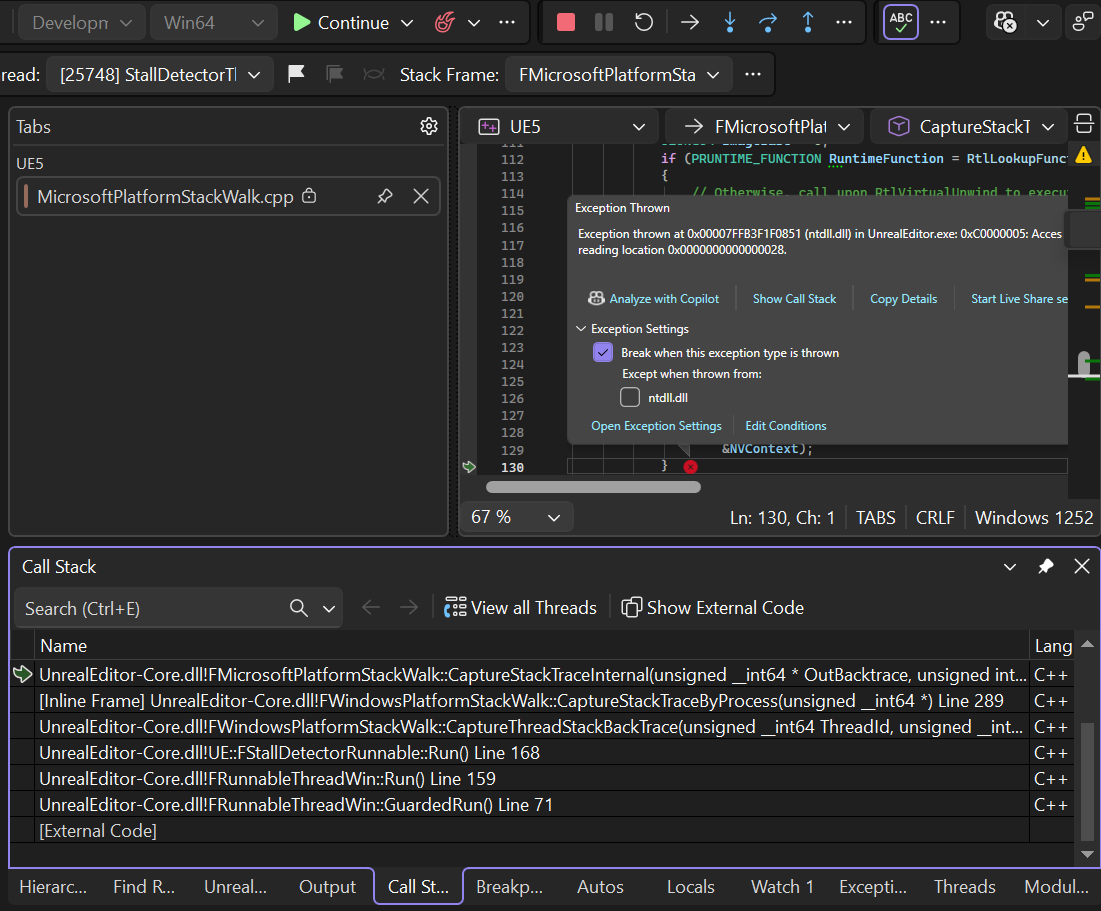
Visual Studio breaking with
0xC0000005 Access Violation- Call stacks containing “
StackWalk" Threads containing
StallDetectorThreadStack walking via
RtlVirtualUnwindBreaks only while debugging
No crash when debugger is detached
This is not a real crash.
This is Unreal Engine’s Stall Detector misclassifying valid external modal/message-loop activity as a thread stall, followed by the debugger interrupting during diagnostic stack capture.
What the Stall Detector Actually Does
The Stall Detector is an instrumentation system used by Unreal to identify threads that appear unresponsive.
It works by wrapping critical engine scopes with timers. If execution exceeds a configured budget (often ~2 seconds), Unreal assumes the thread may be deadlocked and attempts to gather diagnostic information.
Importantly:
A stall is not automatically a bug.
It is a heuristic.
The engine cannot distinguish between:
a thread that is truly frozen
a thread that is busy inside an external modal loop
So it errs on the side of reporting.
SCOPE_STALL_COUNTER(SomeScope, TimeBudgetSeconds)
//eg main Engine loop, gives your process 2 seconds to respond
void FEngineLoop::Tick()
{
	SCOPED_NAMED_EVENT_TEXT("FEngineLoop::Tick", FrameColor);
	SCOPE_STALL_COUNTER(FEngineLoop::Tick, 2.0);
}
If a scope exceeds its time budget (often ~2 seconds), the engine:
Assumes the thread may be stuck.
Attempts to capture that thread’s call stack.
Logs diagnostic information.
This is meant to catch deadlocks and infinite loops.
Why External UI Systems Trigger False Stalls
Many UI frameworks — including plugin GUIs — do not follow Unreal’s frame-driven execution model.
Instead, they often:
run modal loops
pump their own Windows messages
block until a popup closes
perform synchronous UI work
Examples include:
dropdown menus
preset browsers
file dialogs
tooltips
blocking progress windows
From Unreal’s perspective, the monitored thread stops ticking engine code.
So the detector concludes:
“Thread appears stalled.”
But the thread is actually busy — just not inside Unreal.
This is a classic false positive.
Where the Access Violation Comes From
After detecting a stall, Unreal attempts to capture a stack trace for diagnostics.
Stack walking through native binaries — especially optimized or protected ones — is not always clean. During this process Windows may raise a structured exception such as:
0xC0000005 Access Violation
These exceptions are frequently handled internally.
However, when Visual Studio is configured to break on thrown Win32 exceptions, it interrupts execution before the handler runs.
This makes the situation look like a crash when it is not.
Detach the debugger, and everything continues normally.
Important: This Is Not Specific to VST Plugins
VST GUIs are simply a very visible example because they ship with full custom UI frameworks.
But the same behavior can occur with:
native Win32 dialogs
external editors
proprietary UI toolkits
embedded browser views
platform file pickers
The root cause is the mismatch between:
Unreal’s tick-based thread expectations
and
externally-driven modal/message loops
Confirming the Issue
A quick sanity check:
If the application runs correctly when the debugger is detached, you are not dealing with a fatal crash.
You are observing debugger behavior during a handled exception.
Solution Options
There are three practical solutions, plus one advanced option.
Solution 1 — Pause the Stall Detector (When You Control the Blocking Scope)
Unreal provides an explicit “ignore stall detector” macro.
SCOPE_STALL_DETECTOR_PAUSE();
This tells the engine:
“We are about to perform a possibly long blocking operation in this scope {}. Do not treat this time as a stall.”
Epic uses this internally when launching Slate modal loops/windows.
However — and this is critical —
It only works if you control the scope that blocks.
Examples where it works well:
launching your own modal window
blocking editor tools
synchronous operations you initiate
custom dialogs
Examples where it does NOT help:
plugin-created dropdowns
internal UI modal loops
third-party toolkits
code paths you do not own or have control over
In those cases, you cannot wrap the blocking period.
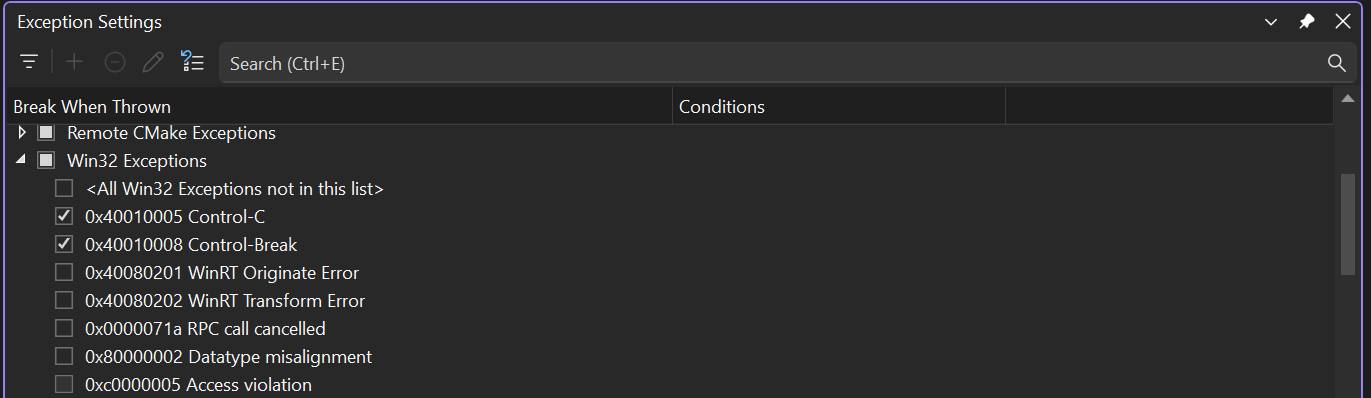
Solution 2 — Disable Breaking on Thrown Access Violations (Recommended)
In Visual Studio Open:
Debug → Windows → Exception Settings
Locate:
Win32 Exceptions → 0xC0000005 Access violation
You want to untick this option. This will avoid the debugger getting triggered when modal windows launch.
Why this is safe
This does NOT hide real crashes.
Visual Studio will still break when an access violation is unhandled and would terminate the process.
You can verify this easily:
With the option unticked try to do something illegal like this Access Violation:
					UObject* Obj = nullptr;
Obj->GetName();
The debugger still stops immediately.
What you are disabling is early interruption on exceptions that are later handled internally.
Many large native systems intentionally raise handled exceptions.
Breaking on all of them makes debugging nearly impossible.
Here’s how to confirm:
Enable ALL win32 Exceptions. Then try to launch the UE Editor, it will keep triggering a lot of exceptions itself. You can right click “Win32 Exceptions” and Reset To Default After.
Solution 3 — Detach the Debugger During UI Interaction
A simple workflow improvement:
Attach debugger for code work
Detach when stress-testing external GUI interaction
This avoids debugger interruption while preserving normal runtime behavior.
4 — Hook Native Window Events
It is technically possible to monitor or intercept Win32 window events (HWND message hooks) to better coordinate with Unreal’s expectations.
For example, detecting when a popup enters a modal loop.
However:
This is complex
Platform-specific
brittle across frameworks
rarely worth the maintenance cost
It is generally not recommended unless you are building a very low-level host.
Is This an Editor Problem Only?
In most standard configurations — yes.
The Stall Detector is compiled only when conditions like the following are true:
WITH_EDITORnot
UE_BUILD_SHIPPINGcounters tracing enabled
In shipping builds, the detector is typically not active.
So this behavior primarily affects development and debugging, not end users.
Final Perspective
Embedding external native UI into a large engine inevitably creates moments where the engine’s assumptions about thread behavior do not align with reality.
The Stall Detector is doing its job — detecting something unusual.
It simply cannot know that the thread is busy inside another framework.
Understanding this distinction prevents countless hours of chasing non-bugs.
Once properly configured, these interruptions disappear, and your integration can be evaluated based on real stability rather than debugger artifacts.